Counting the costs of industrial pollution
The societal costs or ‘externalities’ of air pollution from large industrial facilities are high and include impacts on human health, ecosystems, infrastructure and the climate. Within the European Green Deal, the European Union is committed to the transition to climate neutrality, alongside a zero-pollution ambition. European industry also has an important role to play in this shift, reinforcing Europe’s credentials as a leader in the ‘green’ industry.
Key messages
- Europe’s industry has made significant progress in reducing its environment and climate impacts. However, the societal costs or ‘externalities’ caused by air pollution from the sector remain high and include damage to human health, ecosystems, infrastructure and the climate.
- A small number of industrial facilities are responsible for 50% of the damage caused by air pollution, mostly emitted from within Germany, the UK, Poland, Spain and Italy. When these costs are compared to GDP as an indicator of relative environmental performance per unit of national economic output, the top five comprises Estonia, Bulgaria, Czech Republic, Poland and Slovakia.
- Europe’s Green Deal and zero-pollution targets are an opportunity for change, with industry fully engaged in the conversation and positioned to become a key part of the solution.
Revealing the societal costs of industrial emissions
This briefing is based on Costs of air pollution from European industrial facilities 2008–2017, a report from the EEA’s European Topic Centre on Air Pollution, Transport, Noise and Industrial Pollution (ETC/ATNI). The analysis examines societal or ‘external’ costs caused by industrial emissions from different sites and sectors across Europe, with a strong focus on health impacts. Calculating the extent of the problem (pollutants and polluters), the damage caused and the wider costs to society – in both health and non-health terms – will help us to understand the extent of the challenge as well as the potential of specific solutions.
The ETC/ATNI assessment applies the latest methodological advances to data from 2017 to calculate these external costs, which can then be used to inform discussions by policymakers and industry leaders to tackle air pollution at source and decouple it from economic growth — key objectives of the European Green Deal and Zero Pollution Action Plan (see figure 1).
This report is the latest in a series from the EEA — published in 2011, 2014 and now 2021 — that sheds light on individual sectors, regions and even individual facilities identified as causing the most damage. Sometimes difficult reading for industry, estimating these so-called ‘external costs’ to society has become a key use of data officially reported by industry and countries to the European Pollutant Release and Transfer Register (E-PRTR), now publicly available under the Industrial Emissions Portal (https://industry.eea.europa.eu/).
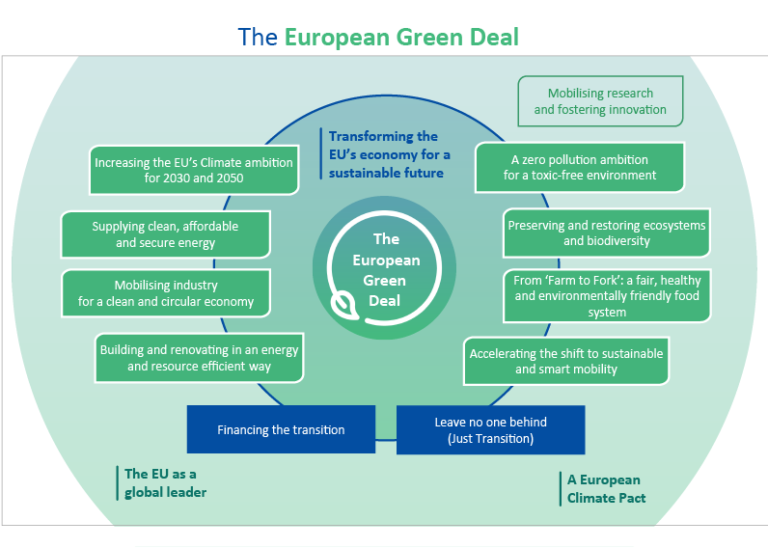
Figure 1. The European Green Deal
What are externalities and how are they calculated?
Externalities are unintended costs of an activity, such as factory waste or power-station emissions, on a third party or society in general. However, the cost of the activity is not directly factored into the price of the product or service. This informs the debate on how to include externalities in the full cost of economic activities, especially accounting for collateral consequences that may be harmful to human health, the environment, and climate.
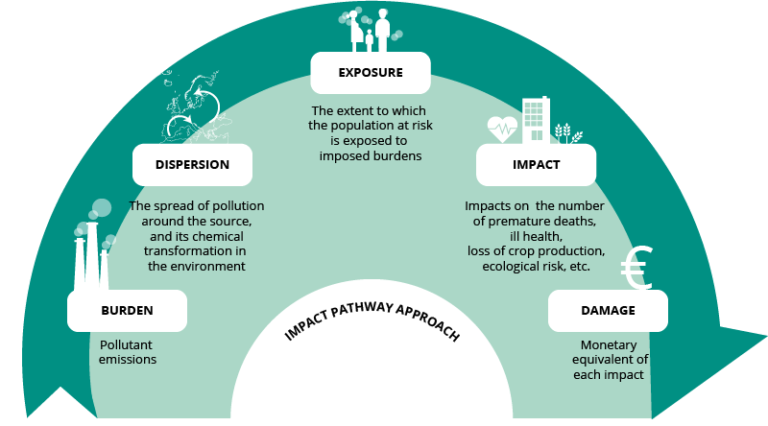
In order to reflect this, the ETC/ATNI work on externalities uses an impact pathway approach (IPA) (see figure 2) to estimate the marginal damage costs per metric tonne for selected key pollutants. Taking the estimated spread of pollution from its industrial source and the resulting chemical releases to the environment, it calculates the effects on humans and the environment (ill-health, deaths, damage to ecosystems/climate/farming, for example) as well as the associated monetary impacts.
Figure 2. Step-by-step schematic of the Impact Pathway Approach framework
The externality assessment focuses on larger operators, including power stations, industrial-chemical complexes, refineries, waste incinerators and others across Europe (EEA38[2] and the UK) for which facility-level information is reported to the E-PRTR. It looks at their main emissions and selected impacts with a focus on health.
The main air pollutants examined include particulate matter (PM2.5, PM10), sulphur dioxide (SO2), ammonia (NH3), nitrogen oxides (NOX) and non-methane volatile organic compounds (NMVOCs). Heavy metals covered include arsenic, cadmium, chromium VI, lead, mercury and nickel. Organic pollutants studied include butadiene, benzene, formaldehyde, Polycyclic Aromatic Hydrocarbons (PAH), dioxins and furans.
The greenhouse gases (GHG) assessed are carbon dioxide, methane and nitrous oxide. Their damage cost is valued using as a proxy the carbon abatement cost required to comply with the Paris Agreement, which seeks to limit global warming increase to below 2°C above pre-industrial temperatures.
A robust and updated method is used in the latest reporting to value the damage to health caused by the main air pollutants. These impacts are quantified with two contrasting but complementary approaches (see box 1).
Box 1
Damage to health caused by the main air pollutants, shown as:
- the value of statistical life (VSL): an estimate of damage costs based on how much people are willing to pay for a reduction in their risk of dying from adverse health conditions; and
- the value of a life year (VOLY): an estimate of damage costs based on the potential years of life lost (YOLL) which takes into account the age at which deaths occur (higher weighting for younger people).
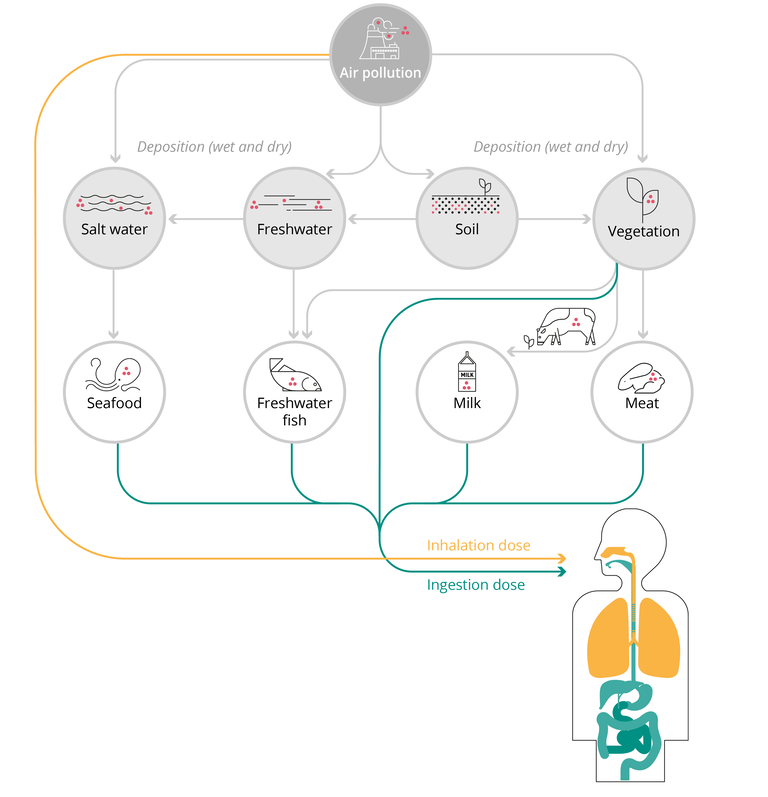
How are we exposed?
One example of direct or linear exposure to air pollution is inhalation. Those living in large industrial cities or regions typically experience more pollution than rural communities. For other pollutants, such as heavy metals, the pathway is more complex. It can be through inhalation, but also through the consumption of contaminated food and drink (see figure 3).
Besides people, air pollution and/or GHG emissions also harm plants, animals and their habitats, altering breeding cycles and biodiversity. Pollutants can also deposit on buildings and monuments and corrode vital infrastructure requiring costly repairs.
Figure 3. Pathways showing exposure to air pollutants and potential health impacts
Estimating the cost of the damage
Air pollution is indiscriminate and ignores regional and national borders. Emissions lead to damage and the costs are borne by society as a whole. While the geographical spread of external costs is dispersed, the final impacts often tend to affect more vulnerable and disadvantaged groups due to underlying health problems, age and socio-economic differences.
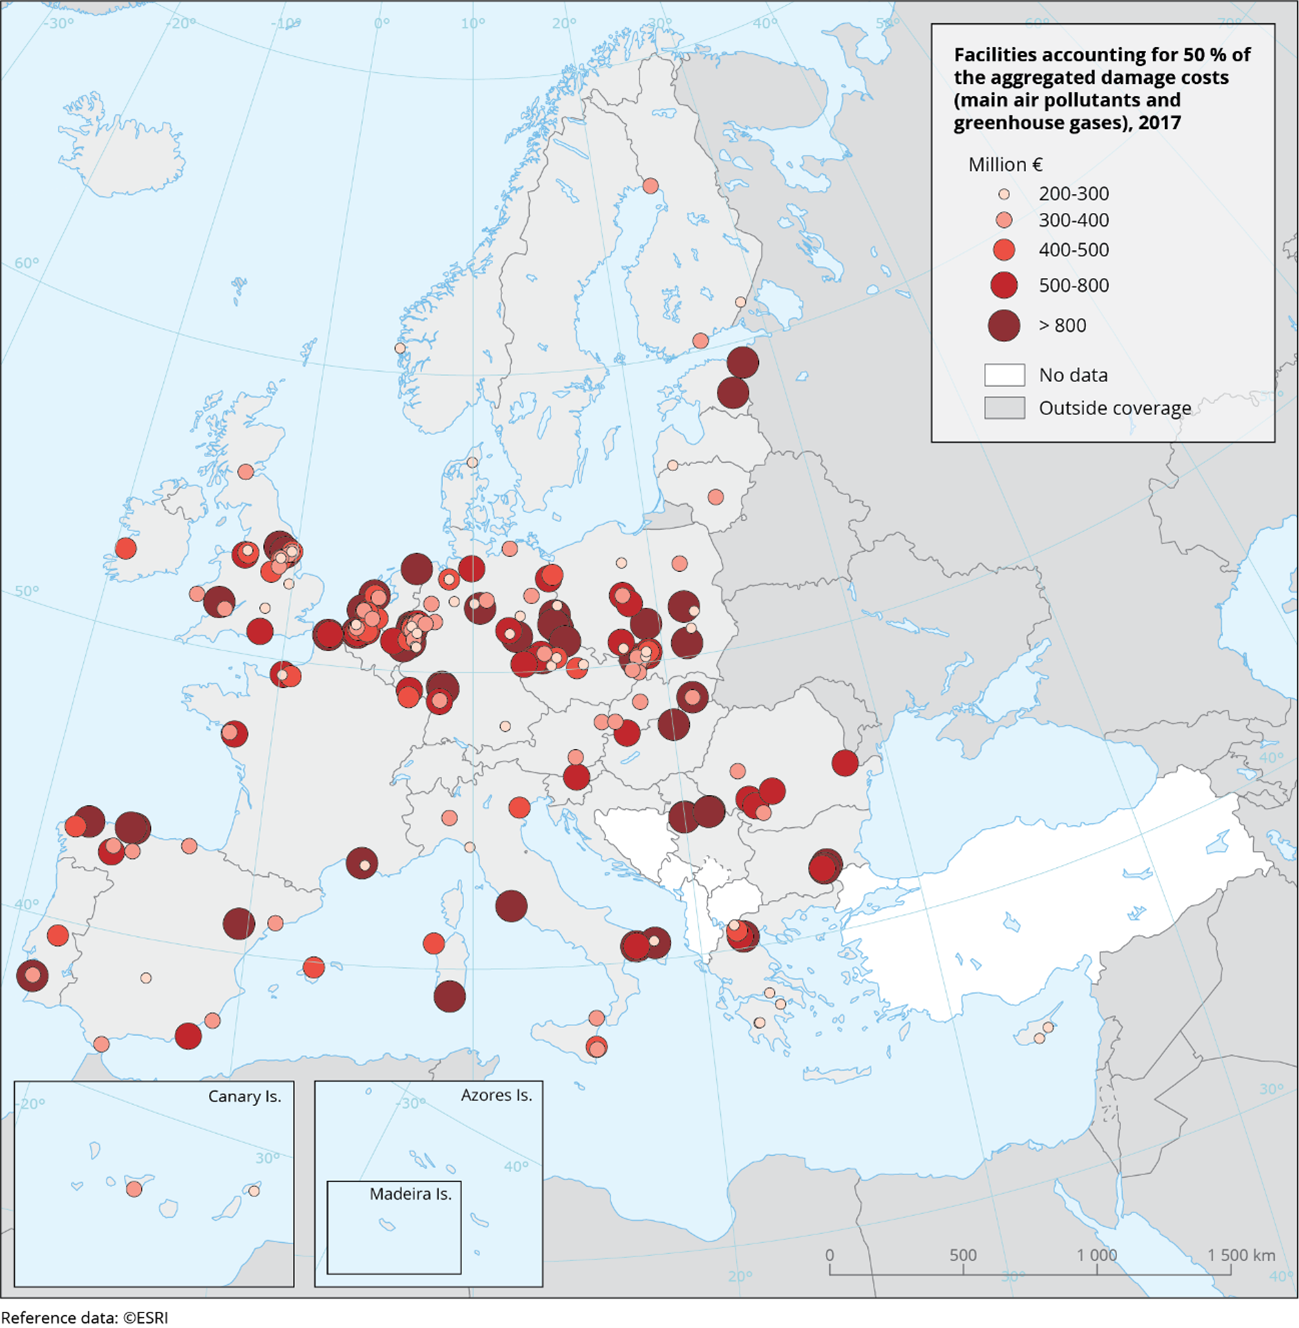
Consistent with the results from EEA’s earlier studies, a relatively small number of facilities continue to be responsible for the majority of the quantified external costs. In 2017, air pollution emitted from large industrial sites in Europe is estimated to have cost society between €277 and €433 billion. This is equivalent to about 2-3 % of EU GDP, and is higher than many individual Member States’ total economic output that year. As map 1 shows, just 211 facilities (of the total 11 655 reporting air emissions from selected pollutants in E-PRTR in 2017) caused 50 % of the aggregated damage costs among the main air pollutants plus greenhouse gases.
Air pollution from thermal power plants causes the most external damage to health and the environment. In total, 24 of the top-30 polluting facilities are thermal power stations (the majority use coal, some combine gas or oil), with fifteen located in western and northern Europe (seven in Germany) and a further nine in eastern and south-eastern Europe. While the most polluting power station is located in Poland, four of the top five are in Germany.
Map 1. Localisation of the 211 facilities accounting for 50 % of the aggregate damage costs from main air pollutants and greenhouse gases (2017)
Notes: Mortality valued using the value of a life year (VOLY).
Euro price base: 2019
Source: ETC/ATNI, 2021.
More info
The updated assessment also identifies the sectors with the highest externalities. This list is topped by the energy sector, followed by heavy industry, fuel production and processing, light industry, waste management, livestock and wastewater treatment.
The main polluting facilities are located in Germany, the UK, Poland, Spain and Italy. These countries also have the largest facilities and the highest number of sites reporting to E-PRTR. When these costs are compared to GDP as an indicator of relative environmental performance per unit of national economic output, the top five comprises Estonia, Bulgaria, Czech Republic, Poland and Slovakia. Poland is in the top five of both groupings.
Total quantified external costs from industrial air pollution by pollutant groups (2017)
Aggregated external costs (million €) | |
Main air pollutants (NH3, NOX, PM10, SO2, NMVOCs)
Greenhouse gases (CO2, CH4, N2O)
Heavy metals (As, Cd, Cr, Hg, Ni, Pb)
Organic pollutants (benzene, dioxins and furans, PAHs)
Total | 68 165 – 223 350 |
197 269 | |
11 775 | |
137 | |
277 346 – 432 532 | |
Notes: For the main air pollutants, the lower value of the range is a calculation of mortality using VOLY, while the upper value uses VSL.
Euro price base: 2019
Source: ETC/ATNI, 2021.
Where are we heading?
For future calculations of the externalities caused by industry, the EEA is exploring ways to further refine the methodology for calculating marginal costs per tonne of pollutant, as well as introducing additional sector-specific adjustments to the calculations of total damage costs. To enable a better assessment of the relative damage costs per unit of economic output — i.e. plant efficiency — a planned compulsory reporting field in E-PRTR which would allow facilities to report their production volumes[5], along with possible additional fields on contextual information, may help.
The goal of this type of assessment by EEA is to establish ways to ‘normalise’ external cost considerations within total production to account for plant efficiency, while finding green solutions for better industrial productivity and paths to decarbonisation which help Europe reach its zero-pollution targets.
How can we change the conversation?
As providers of goods, jobs, essential materials and taxable revenues, industry is no less vital to Europe’s socio-economic success today than it was a decade ago when the EEA first started reporting on pollution externalities.
The European Green Deal is just one recent example of how the conversation is changing as awareness grows on the costs and benefits to society of industrial activity. The way forward is as much about changing our ways as it is about changing the narrative and how we work together.
Change is not only possible, but it is demanded by politicians, business and society. There has been a clear shift in outlook since the last report in 2014, underlined by greater awareness of environmental issues and market trends, from circularity, carbon offsetting and impact investing to the sharing economy.
There is a clear European dimension here, not least because air pollution has no respect for national boundaries or political agendas. Harmful pollutants are emitted in one time zone and weather patterns and atmospheric chemistry decide whose problem they become. The EU’s added value is to make it a shared problem with shared ambitions and solutions, bringing Member States together as one group with a vision for the next generation.
The European Green Deal and zero-pollution ambition are an opportunity for change. Together with EEA reporting, they signal to all polluters what is happening and what is expected, but also what is possible with the right incentives (financial, technical, behavioural) in place. Forward-looking industry is taking notice. Responsible companies and sectors have already been cleaning up their operations over recent years, while insightful businesses are making much greener choices all round, and transformational companies are seeing new opportunities for value-creation in whole new markets. All seek to be part of the solution, not the problem.